How we present a business case to a CEO at Made by Many

One of the key outputs of our vision and discovery service package is a business case. This blog post explains how we present this to a CEO and their team.
There are a number of different ways to present a business case, and this typically means including both a plan and its underlying model.
A month-by-month income statement/cashflow projection/balance sheet can help to lay out the fundamentals of a new venture, and Lean Canvas is a great way to capture the inputs and outputs of a product system: its underlying model.
But in the work that we do – creating, designing and building new products and services – when we’re presenting a business case to a CEO, we’re usually helping them answer one big question: should I continue to invest in this initiative?

We typically use a chart like this to do so, and this allows the CEO to answer four common follow-up questions:
1. What’s the peak investment requirement?
2. How long does it take to get this money back?
3. When does it become profitable?
4. Can we invest in phases?
Let’s look at those questions in a bit more detail.
1. What’s the peak investment requirement?
A CEO and their CFO are almost always interested to know how much they’re going to have to spend before they start seeing net returns.
This might be because their organisation is cash constrained – though thankfully most of our clients aren’t – but it’s most likely to be because they want to get a sense of the level of risk involved in the initiative.
If the peak investment requirement is high and there’s uncertainty about the size or speed of returns – or even whether the initiative might deliver success at all – this is a good sign that we need to reconsider how we’re designing the programme as a whole, as it’s unlikely that a CEO would sign off further investment.
2. How long does it take to get this money back?
Most of our clients expect large scale digital product or service initiatives to generate a positive return on investment within anywhere between 2 and 5 years.
This is primarily driven by shareholder, investor or internal expectations about acceptable levels of risk and reward.
3. When does it become profitable?
There’s a distinction between profitability and positive RoI: a product will become profitable at a monthly (or weekly or whatever) level before it pays back the initial investment.
This is more likely to be a concern for a cash-constrained organisation, but is also a good signal about the likelihood of generating a positive return on investment. If a product requires a large maximum outlay but becomes profitable quickly, some of the CEO’s concern about the initial investment might be allayed.
The time at which the initiative becomes profitable defines the moment of peak investment – once you start making a profit, you start paying it back.
4. Can we invest in phases?
For larger or more complex initiatives, this is a common question for a CEO. Does it require me to commit to investment all in one go, or can I invest a bit, watch to see how acquisition or revenue behaves, and then invest a bit more?
Much of our work involves helping our clients break down larger initiatves into smaller, more manageable components, but inevitably many of them will require ‘taking a leap’ at some point or other.
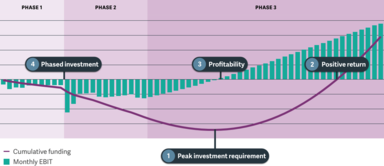
For example, the graph we’re using here is for a new service in a regulated sector. During Phase 1, our client can partner with an existing regulated company to deliver the service. In Phase 2, and once the revenue model is proven, they can ‘take the leap’ to become regulated.
You can see the investment requirement increase substantially in this phase – but in the event that Phase 1 doesn’t go well, it’ll be possible to replan at that point, perhaps extending the partnership to continue to refine the proposition – at lower revenue, but also lower risk.
What’s missing from this presentation approach?
The advantages of this approach are its focus on hard business metrics and its simplicity: you can present it on a single slide. However, it doesn’t do a good job of explaining the product system and underlying model: it just acknowledges that there are some costs and revenue somewhere.
We typically pair it up with a second slide describing more of the detail, and I’ll explore how we do that in another blog post.


